
The value of a pension
The Office of the State Actuary prepared this example to assist DRS with developing a general educational resource. We caution against using this hypothetical illustration for other purposes, including personal financial planning, because (among other limitations) it’s based upon 2023 market conditions and relies on a simplified model. The high-level takeaways also change with different retirement eligibility, total service, salary growth, investment earnings, etc.
We made the following assumptions to develop this example:
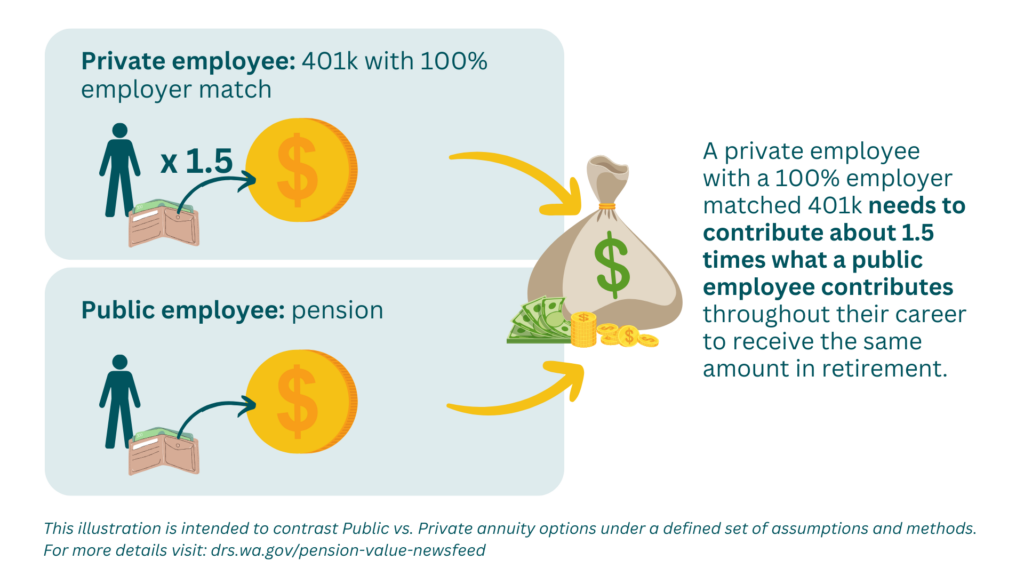
- The WA Public Employee is a Plan 2 Pension member, while the Private Sector Employee with a 401(k) purchases an annuity from an insurance company upon retirement (with an assumed annual investment return of 3.5%). [If the actual imbedded investment rate of return used to annuitize the 401(k) account is higher/lower, then the amount of contributions required to fund the annuity would decrease/increase accordingly.]
- Estimated total Pension contribution rate of 14% is constant throughout their career, implying the total 401(k) contribution rate would need to be about 21% of pay. Both work 30 years and retire at age 65. [If actual investment earnings during the working lifetime of these members are higher/lower than the assumed 7% per year, then the corresponding percent of pay needed would also decrease/increase as a result.]
- Unless stated otherwise above, expectations for investment earnings, salary growth, COLAs in retirement, and life expectancy are consistent with our 2022 Actuarial Valuation Report, along with other relevant assumptions where appropriate. The results in this example may need to be updated in the future to reflect new actuarial valuations and associated assumptions.
This illustration is intended to contrast Public vs. Private annuity options, not Defined Benefit vs. Defined Contribution retirement plan types. For the WA Retirement Systems, Plan 3 members have the opportunity upon retirement to purchase an annuity from WSIB (which currently relies on a 7% assumed investment return) with their Defined Contribution account funds that, when combined with their 1% per year-of-service employer-funded Defined Benefit, would provide substantially similar overall benefits to the 2% per year-of-service Defined Benefit for Plan 2 members.
Michael T. Harbour (ASA, MAAA), served as the responsible actuary for this analysis and believes the assumptions and methods in this illustration are reasonable given its intended purpose. He is available for questions via email: State.Actuary@leg.wa.gov.